

Over the next 4 weeks (advance 4 weeks/ticks in NetLogo), your team runs two laboratory experiments, which cost a total of $10,000.
In the first experiment, you collected 40 garter snakes from the wild which had disease symptoms and randomly assigned them to one of two treatment groups: a control group (n=20 snakes) and a treatment group (n=20 snakes). Each snake was housed in a separate glass aquarium. At the start of the experiment, you applied a common veterinary fungicidal ointment to snakes in the treatment group using a cotton swab. You rubbed a clean cotton swab with no fungicide on it on the faces of control snakes as a "sham treatment". You monitored the snakes for two weeks while feeding and caring for all snakes in the same way, and you recorded any observed disease symptoms. Here is a graph of your results:

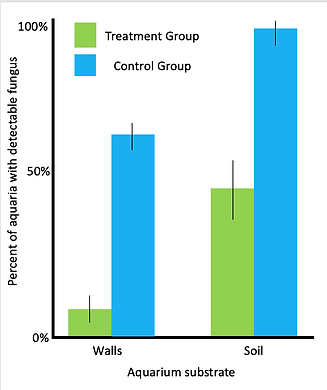
In the second experiment, you collected 40 infected and symptomatic garter snakes from the wild and kept them in individual aquaria for two weeks. Then you removed the infected snakes and did not clean the aquaria. You randomly assigned the empty aquaria to one of two treatment groups: a control group (n=20 snakes) and a treatment group (n=20 snakes). You sprayed a common veterinary fungicide in each of the treatment aquaria and sprayed tap water in the control aquaria. One week later, you swabbed the walls and soil in each aquarium and used PCR to quantify how much fungal DNA was detected on the swabs. Here is a graph of your results:
Managers and scientists are pretty excited about the results of these short experiments, and hope that they are good indicators that longer-term treatment of snakes can be used to conserve sensitive species. Add one point to your charisma! Armed with these new insights, what would you like to do next?
Option 1: Begin a control program.
Time Cost: Depends on which intervention you select
Monetary Cost: Depends on which intervention you select
Charisma Effect: Unknown
Option 2: Do nothing; this is a typical mortality event for a new strain of a wildlife pathogen, and it just needs to run its course.
Time Cost: 12 Weeks/Ticks
Monetary Cost: $0
Charisma Effect: Unknown